datasette code-frequency chart on GitHub
Mirrored from Simon Willison for archival readability. Support the source by reading on the original site.
13th July 2026 - Link Blog
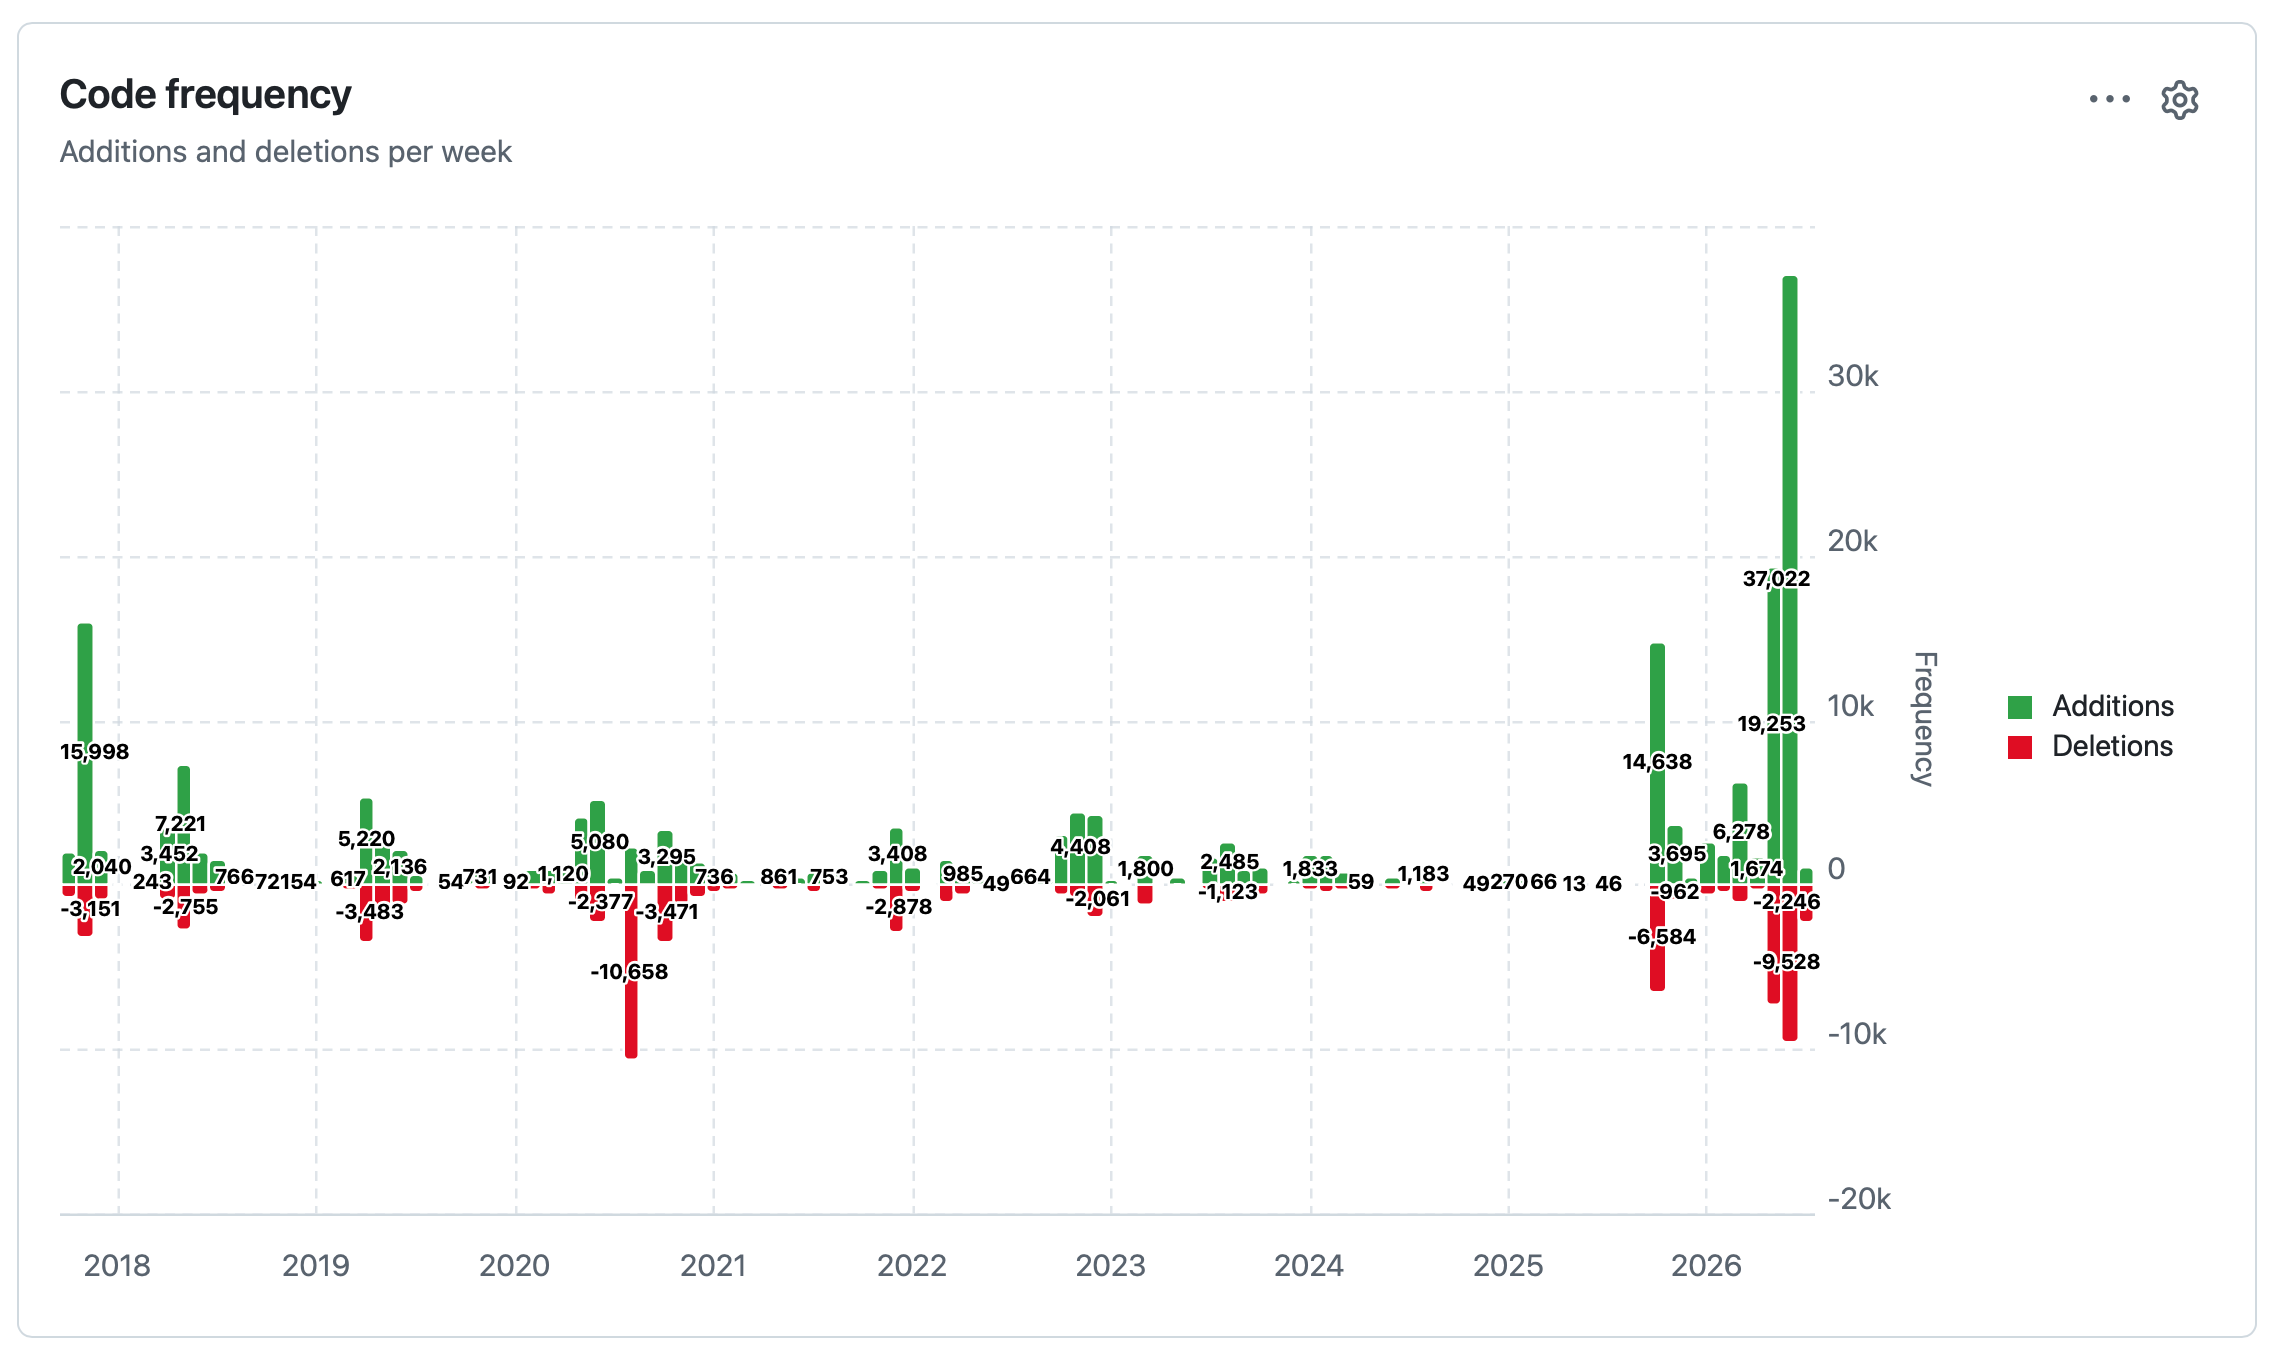
datasette code-frequency chart on GitHub. Out of curiosity I decided to see if I could find a useful illustration of the impact of coding agents and Opus 4.5 class models on my own output. The best I've found so far is this GitHub chart of frequency of code changes to my Datasette open source project:
The big spike in activity at the end aligns with Opus 4.8, GPT-5.5, Fable 5 and GPT-5.6 Sol.
Discussion (0)
Sign in to join the discussion. Free account, 30 seconds — email code or GitHub.
Sign in →No comments yet. Sign in and be the first to say something.